
Two Tipping Points
The image below, adapted from Climate Reanalyzer, shows that the World Sea Surface Temperature (60°South – 60°North) was at a record high of 21.1°C or 69.98°F for the third day in a row on August 23, 2023. As the image also shows, sea surface temperatures over the past few months have been much higher for the time of year than in any other year on record.

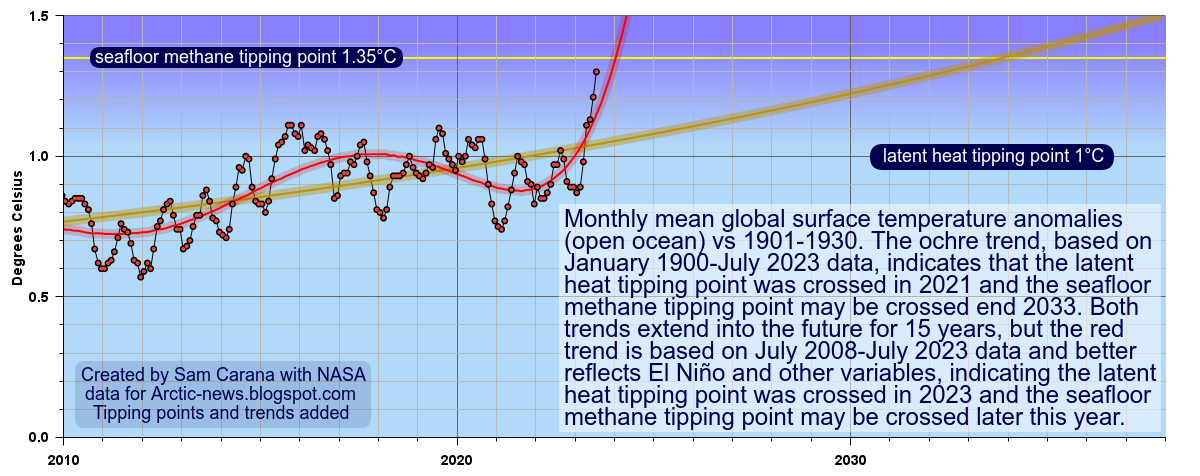
The image below shows why this recent sea surface temperature rise is so worrying. The image below is based on NASA data for monthly mean global surface temperature anomalies (open ocean) vs 1901-1930. The ochre trend, based on January 1900-July 2023 data, indicates that the latent heat tipping point was crossed in 2021 and the seafloor methane tipping point may be crossed by the end of 2033. Both trends extend into the future for 15 years, but the red trend is based on July 2008-July 2023 data and better reflects El Niño and other variables, and this red trend indicates that the latent heat tipping point was crossed in 2023 and the seafloor methane tipping point may be crossed later this year.
 |
| [ click on images to enlarge ] |
Sea ice constitutes a latent heat buffer, consuming incoming heat as it melts. While the ice is melting, all energy (at 334 J/g) goes into changing ice into water and the temperature remains at 0°C (273.15K or 32 °F). Once all ice has turned into water, all subsequent energy goes into heating up the water, and will do so at 4.18 J/g for every 1°C the temperature of the water rises.
 |
| [ The Latent Heat Buffer ] |
 |
| [ sea ice thickness, from earlier post ] |
Loss of this buffer is linked to subsequent destabilization of methane hydrates. So, there are two tipping points that are linked, and the latent heat tipping point gets crossed in the Arctic before the seafloor methane tipping point gets reached.
 |
| [ sea surface temperature anomaly ] |
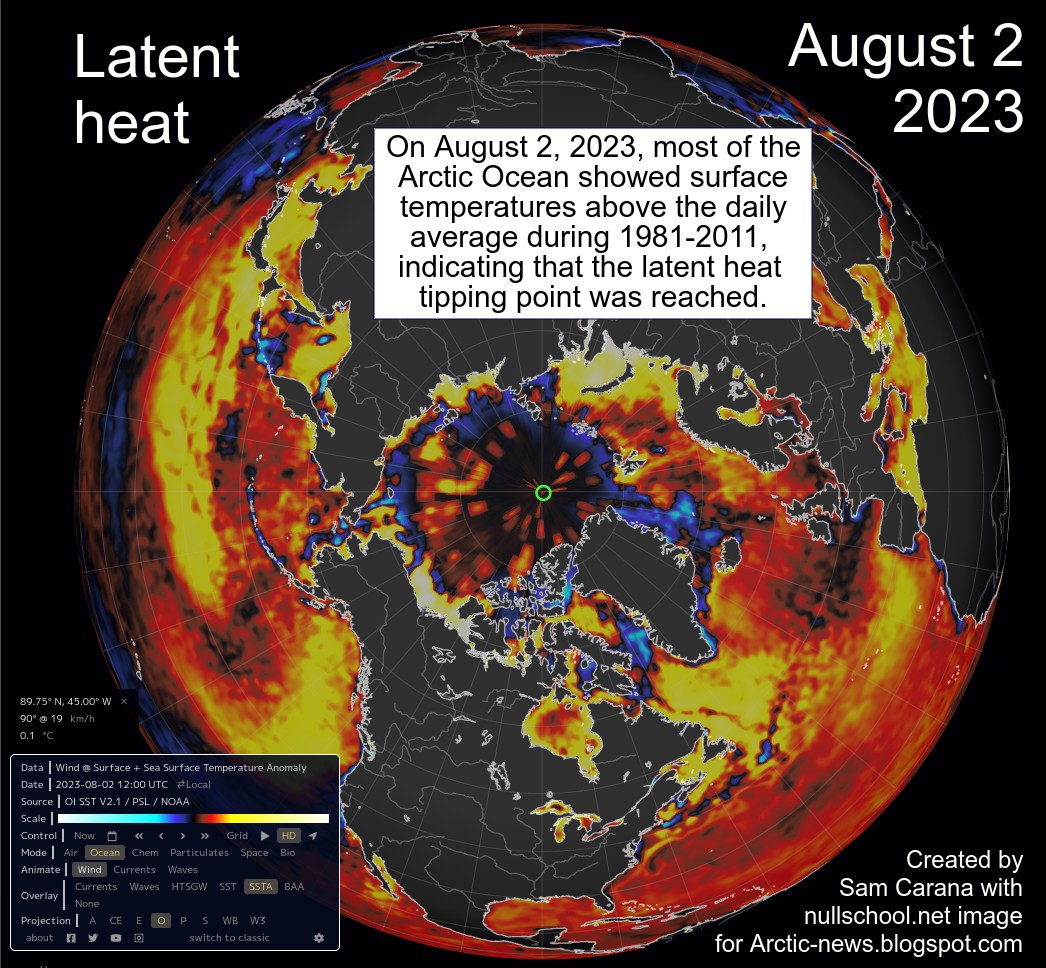
The image on the right, adapted from nullschool.net, shows that on August 2, 2023, most of the Arctic Ocean was showing surface temperatures above the daily average during 1981-2011, indicating that the latent heat tipping point was reached. The latent heat tipping point is estimated to correspond with an ocean temperature anomaly of 1°C above the long term average, 1901-1930 on the above image.
 |
| [ surface temperature ] |
This is a further indication that the latent heat tipping point has been reached and that no more heat can be consumed by sea ice melting.
 |
| [ Satellite view, click on images to enlarge ] |
The danger is that further heat will destabilize hydrates in these sediments, leading to explosive eruptions of methane, as its volume increases 160 to 180-fold when leaving the hydrates, and resulting in huge eruptions of methane both from the destabilizing hydrates and from methane that is present in the form of free gas underneath the hydrates.
 |
| [ from earlier post, click on images to enlarge ] |
The above image, from an earlier post, illustrates that warnings have been given before about the danger of these two tipping points getting crossed in the Arctic. In the above image, the trends are based on annual sea surface temperature data for the Northern Hemisphere. The seafloor methane tipping point is estimated to get crossed when the ocean temperature anomaly on the Northern Hemisphere goes beyond 1.35°C above its long term average.

Stronger winds along the path of the Gulf Stream can at times speed up sea currents that travel underneath the surface. As a result, huge amounts of hot, salty water can travel from the Atlantic Ocean into the Arctic Ocean, abruptly pushing up temperatures and salinity levels at the bottom of the Arctic Ocean, which in many places is very shallow.

The above image shows details of Argo float 9701007, further illustrating the danger that heat can reach the seafloor. North of Norway, where the water is less than 400 m deep, temperatures higher than 5°C show up throughout the vertical water column, up to August 10, 2023, when temperatures above 11°C were recorded close to the sea surface. The colored inset also shows that greater mixing down of heat occurred from October to December 2022, as the sea ice started to return and seal off the surface, preventing heat transfer from ocean to atmosphere, as also discussed at FAQ #11.


 |
| [ 2022 animation ] |
Studies, some of them dating back more than two decades, show that over the shallow East Siberian Arctic Shelf (ESAS) winds at times can mix the water column from the top to the bottom. A 2005 study of the ESAS led by Igor Semiletov recorded water temperatures at the seafloor, in September 2000, of 4.7°C at 20m depth at one location and 2.11°C at 41m depth at another location, with salinity levels of 29.7‰ and of 31.7‰, respectively.
A deformed Jet Stream, in combination with a cyclone, could similarly result in strong winds abruptly pushing a huge amount of heat through the Bering Strait into the Arctic Ocean.

 |
| [ Latent heat loss, feedback #14 on the Feedbacks page ] |
Further adding to the danger is that destabilization of methane hydrates can cause huge amounts of methane to erupt with great force in the form of plumes. Consequently, little of the methane can be broken down in the water by microbes, while there is very little hydroxyl in the atmosphere over the Arctic Ocean to break down the methane that enters the atmosphere.
Ominously, some very high methane levels were recorded recently at Barrow, Alaska, as illustrated by the NOAA images below.

The most recent monthly methane average recorded at Barrow, Alaska, is above 2080 parts per billion.

A catastrophe of unimaginable proportions is unfolding. Life is disappearing from Earth and runaway heating could destroy all life. At 5°C heating, most life on Earth will have disappeared. When looking only at near-term human extinction, 3°C will likely suffice.
The situation is dire and is getting more dire every day, which calls for a Climate Emergency Declaration and implementation of comprehensive and effective action, as described in the Climate Plan with an update at Transforming Society.
• Climate Reanalyzer – daily sea surface temperature
https://climatereanalyzer.org/clim/sst_daily
• Climate Reanalyzer – daily 2-meter air temperature
https://climatereanalyzer.org/clim/t2_daily
• NASA – GISS Surface Temperature Analysis
• University of Bremen – Arctic sea ice
https://seaice.uni-bremen.de/start
• nullschool.net
• NOAA – Barrow Atmospheric Baseline Observatory, United States
https://gml.noaa.gov/dv/iadv/graph.php?code=BRW&program=ccgg&type=ts
• Argo Float
https://fleetmonitoring.euro-argo.eu
• Remnants of Typhoon Merbok forecast to enter the Arctic Ocean through the Bering Strait from September 17 to 19, 2022.
Discussed at https://www.facebook.com/SamCarana/posts/10166948876390161, from:
https://arctic-news.blogspot.com/p/cold-freshwater-lid-on-north-atlantic.html
• The East Siberian Sea as a transition zone between Pacific-derived waters and Arctic shelf waters – by Igor Semiletov et al. (2005)
https://agupubs.onlinelibrary.wiley.com/doi/10.1029/2005GL022490
• Sea surface temperature at record high
https://arctic-news.blogspot.com/2023/03/sea-surface-temperature-at-record-high.html
• Record high North Atlantic sea surface temperature
https://arctic-news.blogspot.com/p/albedo.html
• Latent Heat
https://arctic-news.blogspot.com/p/latent-heat.html
• The Threat of Global Warming causing Near-Term Human Extinction
https://arctic-news.blogspot.com/p/threat.html
• FAQ
https://arctic-news.blogspot.com/p/faq.html
• Feedbacks
https://arctic-news.blogspot.com/p/feedbacks.html
https://arctic-news.blogspot.com/p/climateplan.html
• Transforming Society
https://arctic-news.blogspot.com/2022/10/transforming-society.html
• Climate Emergency Declaration
https://arctic-news.blogspot.com/p/climate-emergency-declaration.html